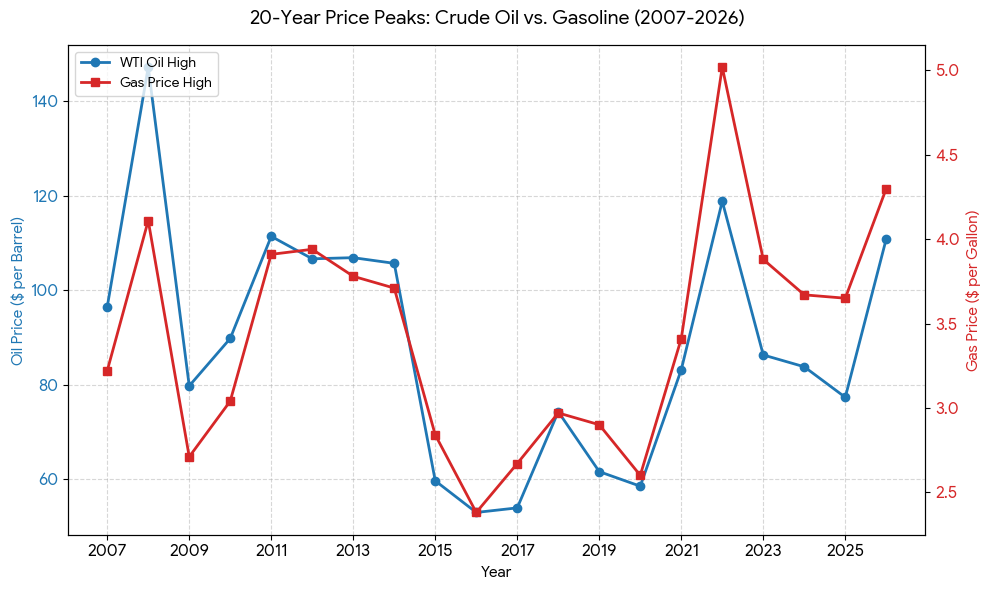
DECATUR, Ind. — Geopolitical instability in the Middle East has pushed energy prices to their highest levels in several years, with crude oil surpassing $110 per barrel and domestic gasoline prices climbing to a yearly peak of $4.30 per gallon.
Data tracking 20 years of energy market fluctuations shows that the current “Iran Conflict” has become the primary driver of market volatility in 2026. This follows a period of “Economic Cooling” in 2025, during which gas prices averaged a more modest $3.65 per gallon.
The recent surge represents a significant shift from the post-pandemic stability seen in 2024, when gasoline prices sat at approximately $3.67. While the current prices are high, they remain below the historical record set in 2022, when the Ukraine invasion drove gasoline to a peak of $5.02 per gallon and crude oil to $118.87.
Market analysts note that while 2026 prices are steep, the global energy landscape has faced similar spikes over the last two decades. Notably, the 2008 “Commodity Boom” still holds the 20-year record for crude oil costs at $147.27 per barrel.
In contrast, the lowest prices in the 20-year data set occurred during the 2020 pandemic-driven demand crash, which saw gas prices drop to $2.60, and the 2009 Great Recession lows of $2.71.
Local residents in Northeast Indiana and Northwest Ohio continue to monitor these trends as regional price discrepancies often fluctuate based on state-level distribution and inventory.
Year |
Oil Peak (WTI / Barrel) |
Gas Peak (Reg. / Gallon) |
Key Driver |
|---|---|---|---|
| 2026 | $110.93 | $4.30 | Iran Conflict |
| 2025 | $77.39 | $3.65 | Economic Cooling |
| 2024 | $83.85 | $3.67 | Post-Pandemic Stability |
| 2023 | $86.35 | $3.88 | Supply Tightening |
| 2022 | $118.87 | $5.02 | Ukraine Invasion |
| 2021 | $83.22 | $3.41 | Economic Rebound |
| 2020 | $58.58 | $2.60 | Pandemic Demand Crash |
| 2019 | $61.66 | $2.90 | Rising U.S. Output |
| 2018 | $74.34 | $2.97 | Geopolitical Sanctions |
| 2017 | $53.99 | $2.67 | OPEC Production Cuts |
| 2016 | $53.02 | $2.38 | Supply Glut Recovery |
| 2015 | $59.72 | $2.84 | Global Oversupply |
| 2014 | $105.74 | $3.71 | Mid-Year Supply Surplus |
| 2013 | $106.94 | $3.78 | Global Demand Growth |
| 2012 | $106.70 | $3.94 | Iran Nuclear Concerns |
| 2011 | $111.45 | $3.91 | Arab Spring Unrest |
| 2010 | $89.84 | $3.04 | Recovering Demand |
| 2009 | $79.80 | $2.71 | Great Recession lows |
| 2008 | $147.27 | $4.11 | Commodity Boom / Peak Demand |
| 2007 | $96.53 | $3.22 | Tight Global Spare Capacity |